 Solar Flare Watch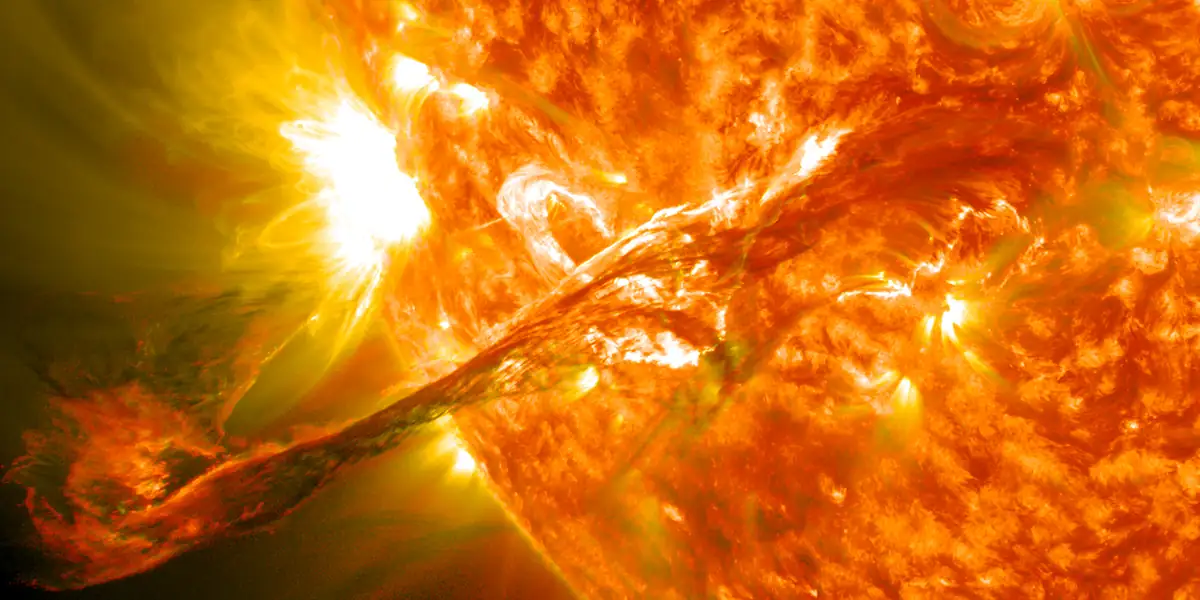
Solar flares today
Last updated:
Latest flareC1.3Oct 9, 2026 10:01 UTC
Times are in UTC. For information only. Figures are reproduced from the cited sources, may be delayed or contain errors, and are not advice of any kind. Always check the original source.
Largest flare, last 7 daysM6.7Oct 8, 2026 15:48 UTC
Numbered sunspot regions6Oct 9, 2026
Monthly sunspot number68.7September 2026
Flares in the last 7 days
| Date | Start | Peak | End | Class |
|---|---|---|---|---|
| Oct 9, 2026 | 09:53 | 10:01 | 10:08 | C1.3 |
| Oct 9, 2026 | 06:39 | 06:48 | 06:53 | C2.9 |
| Oct 9, 2026 | 05:27 | 05:39 | 05:50 | C4.0 |
| Oct 9, 2026 | 04:28 | 04:39 | 04:50 | C1.6 |
| Oct 8, 2026 | 22:33 | 22:44 | 22:53 | C3.5 |
| Oct 8, 2026 | 21:13 | 21:17 | 21:25 | C1.5 |
| Oct 8, 2026 | 20:21 | 20:27 | 20:31 | C2.1 |
| Oct 8, 2026 | 20:12 | 20:19 | 20:21 | C1.9 |
| Oct 8, 2026 | 15:29 | 15:48 | 15:58 | M6.7 |
| Oct 8, 2026 | 00:45 | 00:59 | 01:11 | C1.6 |
| Oct 7, 2026 | 22:39 | 22:46 | 22:50 | C1.1 |
| Oct 7, 2026 | 12:49 | 13:17 | 13:44 | C7.9 |
| Oct 7, 2026 | 12:24 | 12:39 | 12:49 | C1.1 |
| Oct 7, 2026 | 05:26 | 05:34 | 05:43 | C1.6 |
| Oct 7, 2026 | 05:14 | 05:20 | 05:25 | C1.3 |
| Oct 6, 2026 | 21:23 | 21:36 | 21:40 | C2.3 |
| Oct 6, 2026 | 20:29 | 20:33 | 20:38 | C1.8 |
| Oct 6, 2026 | 19:48 | 19:52 | 19:54 | C2.0 |
| Oct 6, 2026 | 19:39 | 19:43 | 19:48 | C1.7 |
| Oct 6, 2026 | 19:17 | 19:21 | 19:25 | C2.0 |
| Oct 6, 2026 | 14:59 | 15:06 | 15:10 | C3.6 |
| Oct 6, 2026 | 13:24 | 13:34 | 13:42 | C1.5 |
| Oct 6, 2026 | 07:47 | 08:05 | 08:13 | M1.8 |
| Oct 6, 2026 | 07:18 | 07:25 | 07:31 | C5.6 |
| Oct 6, 2026 | 05:38 | 06:10 | 06:51 | M1.4 |
| Oct 6, 2026 | 03:40 | 03:51 | 03:57 | C1.1 |
| Oct 6, 2026 | 03:25 | 03:35 | 03:40 | C1.1 |
| Oct 6, 2026 | 02:36 | 02:47 | 02:52 | C5.3 |
| Oct 5, 2026 | 22:42 | 22:47 | 22:50 | C1.2 |
| Oct 5, 2026 | 22:27 | 22:34 | 22:42 | C1.3 |
| Oct 5, 2026 | 18:36 | 18:48 | 18:57 | M1.0 |
| Oct 5, 2026 | 17:47 | 17:55 | 18:04 | B8.4 |
| Oct 5, 2026 | 17:23 | 17:31 | 17:34 | B7.7 |
| Oct 5, 2026 | 14:03 | 14:12 | 14:19 | B5.3 |
| Oct 5, 2026 | 11:55 | 12:00 | 12:02 | C1.3 |
| Oct 5, 2026 | 11:34 | 11:48 | 11:55 | C1.5 |
| Oct 5, 2026 | 05:50 | 06:01 | 06:05 | B9.6 |
| Oct 5, 2026 | 05:37 | 05:47 | 05:50 | B7.9 |
| Oct 4, 2026 | 23:33 | 23:40 | 23:45 | B2.9 |
| Oct 4, 2026 | 22:48 | 22:52 | 22:55 | B4.0 |
| Oct 4, 2026 | 17:49 | 17:57 | 18:01 | B4.3 |
| Oct 4, 2026 | 06:21 | 06:30 | 06:39 | B9.3 |
| Oct 4, 2026 | 06:13 | 06:19 | 06:21 | B3.2 |
| Oct 3, 2026 | 16:12 | 16:18 | 16:27 | B4.5 |
| Oct 3, 2026 | 14:59 | 15:07 | 15:11 | B5.0 |
| Oct 3, 2026 | 14:31 | 14:37 | 14:42 | B3.4 |
| Oct 2, 2026 | 22:31 | 22:37 | 22:40 | B2.9 |
| Oct 2, 2026 | 17:28 | 17:37 | 17:43 | B3.3 |
Sunspot regions today
| Region | Location | Spots | Mag | C % | M % | X % |
|---|---|---|---|---|---|---|
| AR 4549 | N10W41 | 30 | BGD | 85 | 55 | 10 |
| AR 4551 | S13E71 | 2 | B | 30 | 5 | 1 |
| AR 4545 | N18W46 | 8 | B | 15 | 1 | 1 |
| AR 4548 | S13W14 | 1 | A | 5 | 1 | 1 |
| AR 4547 | N15W0* | 0 | – | 0 | 0 | 0 |
| AR 4550 | S16W51 | 0 | – | 1 | 1 | 1 |
C, M and X: NOAA SWPC’s probability (%) of at least one flare of that class from the region in the next 24 hours.
Daily flare logs
Method
Flares: GOES primary satellite X-ray flare list (7 days), kept in an archive by this site so that daily logs remain available. Regions: SWPC solar region summary for the latest observation date. Solar cycle: SWPC observed solar-cycle indices (monthly sunspot number from NOAA SWPC and F10.7 flux). Values are not modified.
About this page
Solar flares are sudden bursts of X-rays from the Sun. This page lists every flare measured by NOAA’s GOES satellites over the last 7 days and the numbered sunspot regions currently on the visible disk.